


American Express: Keeping pace, falling behind or pulling ahead?
A closer look presents a mixed picture with something for the bulls and bears to hang their hats on

The Big Picture
American Express is No. 8 on My Top 10 Businesses in Payments and FinTech (ahead of No. 10 Corpay Link and No. 9 Shift4 Payments Link). When I started this exercise, I expected American Express to rank higher, possibly in the top five. But my analysis yielded mixed results. On one hand, management argues improvements in the company’s model will support higher growth moving forward. On the other hand, the company’s performance reveals a long-term decline in U.S. market share amid rising rewards spending, suggesting a highly competitive environment. The market appears to be siding with management, for now, as the stock moves closer to a market multiple and closes the gap with Visa and Mastercard.
Let’s take a closer look at the most prominent bull and bear points for American Express, focusing on the data:
Bull Point #1 - American Express is growing at a faster rate than before the pandemic
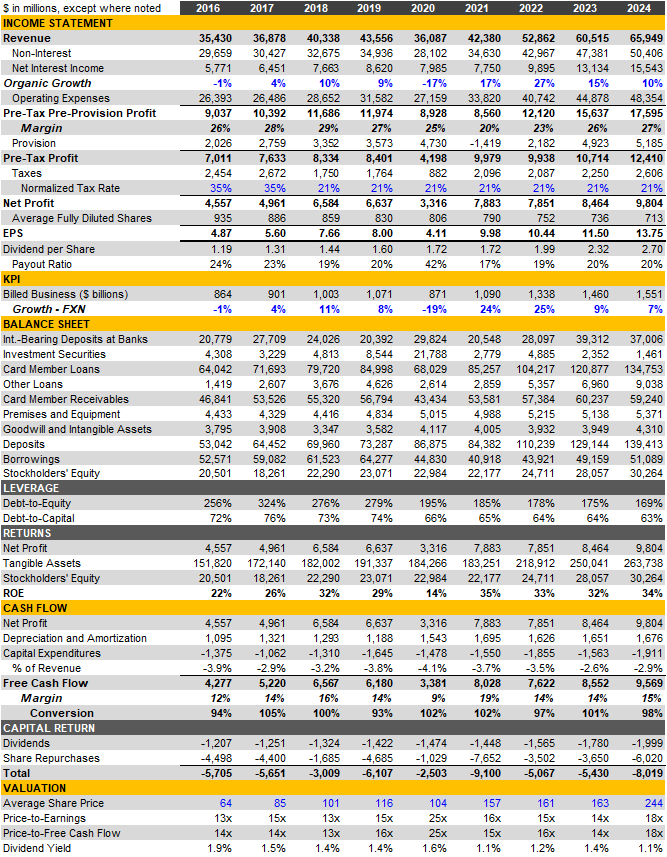
At first glance, American Express' growth rate appears stronger since the pandemic began (8.7% revenue CAGR, 2019-2024) than in the period immediately prior (7.1% revenue CAGR, 2016-2019).
But that's misleading. 2017 was impacted by the loss of Costco—adjusted revenue growth was 8%, not 4%. Accounting for this and FX impacts, the revenue CAGR from 2016-2019 (8.9%) is nearly identical to 2019-2024 (9.3%).
In fact, the growth rates for 2024 and 20251 are identical to 2018 and 2019.
American Express’ long-term aspiration is to grow revenue above 10%, but the company’s 2025 guidance falls below that.

Source: American Express Investor Presentation
The Verdict: To be determined, but does it matter? High single-digit revenue growth is attractive, especially since American Express generates significant revenue from everyday cardholder spending and annual fees.
Bear Point #1 - American Express' U.S. credit card market share has declined long-term and stagnated recently, despite assurances of progress
After losing Costco in June 2016, American Express' U.S. credit market share dropped from 25.4% to 21.1%. It declined further during the pandemic, reaching a low of 18.8% in 2020. After recovering to 19.4% in 2022, it has remained relatively stable, despite assurances of progress.
A closer look reveals this is primarily a mix issue, not a market share issue. Small and mid-sized enterprises (SMEs) represent 37% of American Express’ U.S. billed business, but only 14% of the U.S. credit card market.
SME volume grew at a 1.5% compound annual rate from 2022–2024. As a result, American Express's overall U.S. credit share fell slightly, despite gains in Consumer and SME share.
The Verdict: Normalizing for mix (i.e., assuming American Express' billed business mix mirrors the market), its share would have risen to 19.8% in 2024, up 40 bps from 2022 (but still below its pre-pandemic level of 20.5%).
Bull Point #2 - American Express’ spend and fee-centric model is dramatically better than its competitors
American Express generates more revenue from discount and cardholder fees than its peers, but their presentation is misleading.

Source: American Express Investor Presentation
American Express reports discount revenue on a gross basis, classifying rewards costs and partner payments as expenses. Its peers treat these costs as contra-revenue, deducting them from interchange fees.
The Verdict: Standardized accounting shows a closer mix, but American Express maintains a superior model, with 76% of revenue from spending and fees compared to 41% for its peers.
Bear Point #2 - Rewards spending has increased significantly with no signs of stopping
From 2015 to 2024, American Express’ rewards costs increased from 0.80% of billed business to 1.07%.
A broader measure of spending, which includes card member rewards and services and business development costs (also referred to as rewards costs and partner payments below), was 1.76% of billed business during 2024, up from 1.42% in 2020.
Though seemingly high, it's in line with peers2 and trails key competitors in the affluent category: J.P. Morgan, Citi, and Bank of America.
The Verdict: Rewards spending and partner payments as a percent of billed business is likely to move higher for American Express. Given the company’s premium card member base, I believe American Express should lead premium peers, not trail them.
Bull Point #3 - American Express’ credit performance remains best in class, widening the gap versus peers since the pandemic
No lies detected. American Express’ loan growth has outpaced the industry heading into and out of the pandemic.
While credit performance remains best in class.
The Verdict: At 2.9%, American Express' net write-off rate on average card member loans is 1.4% below the industry. Compared to Q1 2017, when it was 1.2% below, this suggests American Express has widened its credit lead.
Bear Point #3 - American Express’ model fails to generate adequate operating leverage
American Express’ pre-tax, pre-provision profit margin finished 2024 90 bps below its pre-pandemic level.
Since 2019, salaries, employee benefits, and other expenses generated 420 bps of operating leverage, but card member rewards, services, marketing, and business development expenses deleveraged by 510 bps.
The Verdict: I see limited levers for American Express to pull to achieve significant operating leverage in the medium term, especially as it lags premium peers in rewards spending and partner payments as a percentage of billed business.
Company Overview
Unlike Visa and Mastercard, American Express operates a closed loop payments network. What’s the difference?
Visa and Mastercard manage only the technology infrastructure. Banks issue cards and acquirers and payment service providers (PSPs) enroll merchants to accept them.
American Express operates the technology infrastructure, issues cards, and contracts directly with merchants for acceptance. Exceptions include select banks issuing cards on its network and the OptBlue program, where American Express utilities acquirers and PSPs to boost acceptance among small and mid-sized businesses and international merchants.
From an economic perspective:
Visa and Mastercard earn a small fee each time a transaction is completed over their network. They do not earn interchange (which passes from the merchant to the issuer and is the primary economic exchange in a card transaction), net interest income or annual cardholder fees.
American Express, as issuer and merchant acquirer, captures the full merchant discount, the interchange equivalent to Visa and Mastercard. They also earn net interest on outstanding balances, bear credit risk, and collect annual cardholder fees.
Types of Products
Proprietary Charge and Credit Cards. American Express issues charge cards and credit cards. Charge cards have no preset spending limit but must be paid in full each billing cycle, ideal for affluent consumers and small businesses with significant working capital needs. Credit cards have a preset limit, revolve, and generate interest for American Express, with higher loss rates.
Co-Brand Cards. American Express partners with travel and entertainment companies, including Delta, Hilton, Marriott, and British Airways, to issue co-brand cards. These cards accounted for 25% of American Express's global billed business in 2024.
Billed Business Mix
Travel and entertainment (air travel, hotels, and restaurants) spending accounted for 27% of American Express's 2024 global billed business. The Bureau of Economic Analysis reports these categories made up less than 10% of U.S. personal consumption expenditures.
Consumers accounted for 58% of American Express' 2024 global billed business, with Commercial making up 42%. The U.S. contributed 76%, and the rest of the world 24%.
Revenue Mix
Discount revenue (53%), net interest income (24%) and net card fees (13%) made up 90% of American Express’ revenue in 2024.
Net interest income and net card fees make up 37% of revenue now versus 24% in 2016. At the same time, discount revenue fell from 63% to 55%.
U.S. was 78% of 2024 revenue, slightly higher than the 76% billed business mix. American Express’ largest markets outside the U.S. are Mexico, Australia, the U.K., Japan and Canada.
Competition
American Express competes with Visa, Mastercard, Discover, and card issuers like J.P. Morgan, Capital One, Citi, Bank of America, and Discover.
For prospective issuers, American Express competes primarily with Visa and Mastercard.
For prospective co-brand partners, American Express competes with Visa, Mastercard and other issuers.
For prospective card members, American Express competes with other issuers.
Affluent consumers and the partners that deliver them are highly coveted, prompting issuers and networks to compete for them aggressively, mainly through the type and level of rewards and incentive payments for partners.
Investment Checklist
Below is an evaluation of American Express using my Investing Checklist.

Disclosure. American Express offers excellent disclosure, reporting key metrics like billed business, processed volume, and cards outstanding. It segments billed business by geography, customer type, spending category, and demographic. The company reports primarily on a GAAP basis, adjusting earnings only for non-operating gains and losses.
Growth. American Express averaged organic revenue growth of about 8% over the past decade with minimal acquisition activity. The company relies on partners to reach affluent consumers and 25% of the company’s billed business comes from them, including 12% from Delta. The loss of any key partner would have a negative impact on American Express. Even if they are able to renew them, it is likely to be at terms that are less favorable for American Express. The company has been increasing its annual card member fees to reflect better rewards value, not just for the sake of raising prices.
Profitability. American Express’ pre-tax, pre-provision profit margin finished 2024 90 bps below its pre-pandemic level. Since 2019, salaries, employee benefits, and other expenses generated 420 bps of operating leverage, but card member rewards, services, marketing, and business development expenses deleveraged by 510 bps.
Financial Health. American Express’ Common Equity Tier 1, or CET1, ratio stood at 10.7% at the end of Q1 2025, above the regulatory minimum of 7% and in-line with the company’s long-term target.
Returns. American Express’ return on equity was 34% during 2024, best in class among banks and consumer finance companies.
Capital Allocation. American Express pays a growing dividend and buys back stock with its excess capital. In the last nine years, the company has repurchased over $37 billion of its own stock and paid dividends totaling $13.5 billion. The company’s per share dividend has grown at a compound annual rate of 11% since 2016.
Disclosure: I am long Visa. I do not hold a position in any of the other stocks mentioned in this report. This report is for informational purposes only and is not a recommendation to buy or sell any stock. Finally, while I rely on the information in this report to guide my investment decisions, you should not, because I cannot guarantee its accuracy.
Based on the midpoint of American Express’ 2025 guidance for 8-10% revenue growth
Represents the aggregate of J.P. Morgan, Capital One, Citi, Bank of America and Discover